El Niño is here. Will it be “super” in strength and impact?
After a warmer-than-normal winter, there is a lot of buzz about the predicted “super El Niño” and its impact to climate patterns in the Pacific Northwest late this year and into 2027. NOAA’s latest outlook shows that El Niño has arrived, with roughly a two-thirds chance it reaches “super” strength. So, what exactly is a super El Niño and what might it mean for King County streams?
El Niño is one component of a natural cycle called the El Niño-Southern Oscillation, or ENSO, which is a natural periodic swing in sea surface temperatures across the tropical Pacific Ocean. Those temperatures impact atmospheric conditions, which have ripple effects on weather patterns globally. When the sea surface temperature varies by more than 0.5 degrees Celsius, we call it El Niño when it’s warmer than average and La Niña when it’s cooler than average, with ENSO-neutral conditions in place otherwise.
The severity of the El Niño/La Niña conditions is therefore measured by how far above or below normal the tropical sea surface temperatures are. “Super” isn’t an official NOAA designation, but it commonly references the strongest El Niño events in which the tropical waters are more than 2 degrees Celsius above normal. Only a handful of events have cleared that bar in the modern record, with 1997–1998 and 2015–2016 winters being the two most recent.

What recent analyses tell us about this El Niño
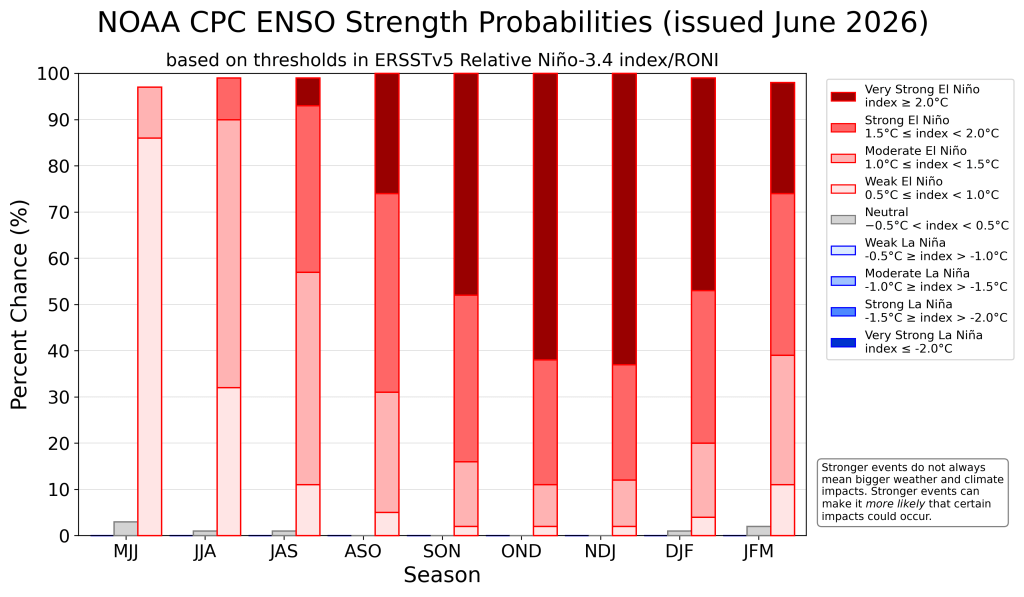
NOAA’s Climate Prediction Center issued an El Niño Advisory on June 11th, meaning El Niño conditions are here and are expected to continue. The “super” modifier is looking more likely as well, with the June outlook revealing a more than 60% chance of reaching a “super” El Niño between November and December of this year.
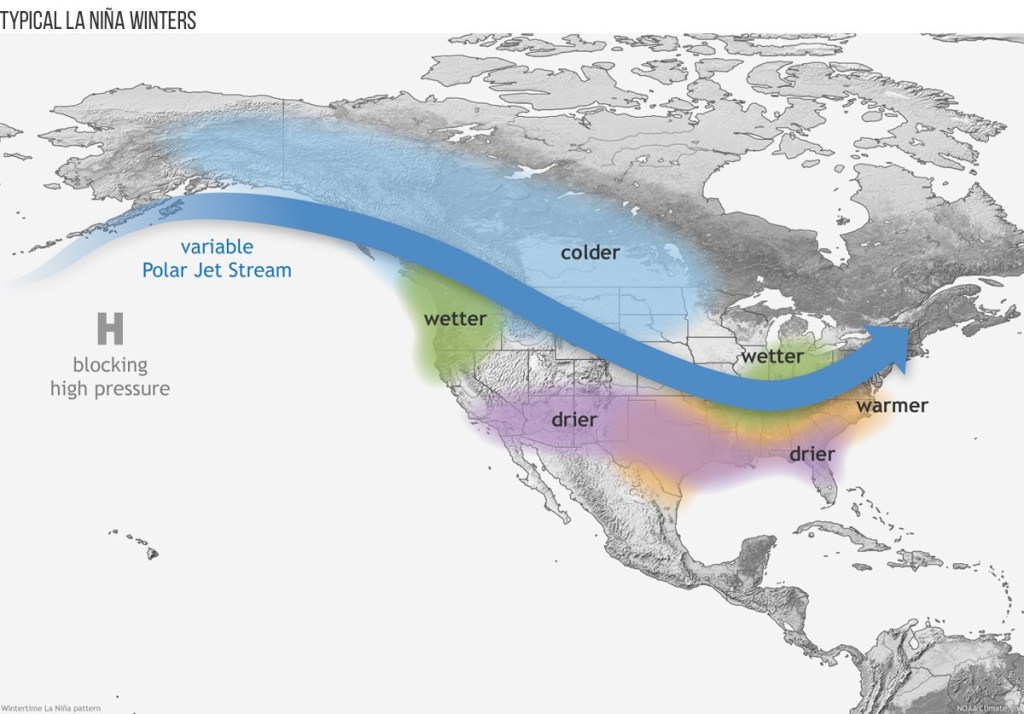
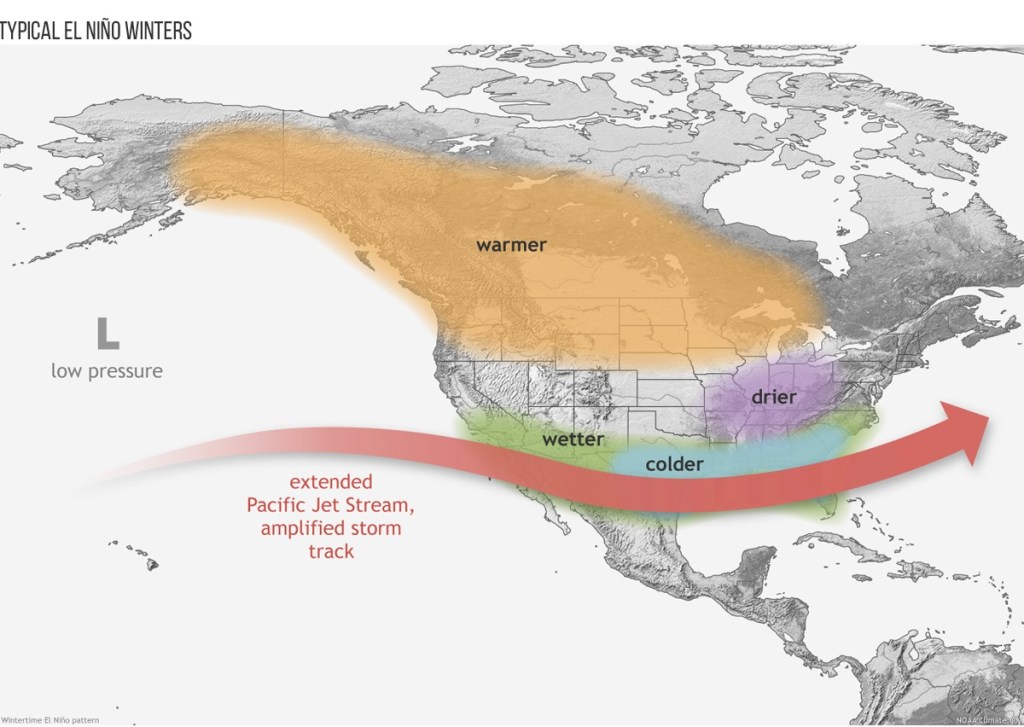
We’ve analyzed impacts of ENSO on snowpack, stream flows, and stream temperatures in a prior newsletter. To recap: El Niño tends to nudge the winter storm track south, leaving King County and the rest of the Pacific Northwest with slightly warmer, drier winters and less mountain snowpack.
While the impacts of each ENSO phase are variable, historical snowpack data show stronger ENSO phases tend to exacerbate the impacts. Those conditions manifest as lower spring stream flows and warmer stream temperatures heading into the following dry season.
For example, the gages on the South Fork Tolt River upstream of the South Fork Tolt Reservoir (USGS gage 12147600) and the Cedar River upstream of Chester Morse Reservoir (USGS gage 12115000) are two of the longest-term gages with discharge and temperature data on snowmelt-fed streams in the County. Again, there is a lot of variability, but spring flows associated with snowmelt tend to be muted in El Niño years compared to La Niña years, and water temperatures tend to be warmer in winter and spring.

What might we expect in King County if the super El Niño develops?
Because we’ve only seen a few super events since our stream gages began monitoring, we have limited data to analyze. As an exploratory exercise, though, it’s worth revisiting how King County streams behaved during the two most recent super El Niños—the winters of 1997–1998 and 2015–2016, which were among the strongest in the modern record.
Globally, these events were consequential. Scientists linked the 2015–2016 El Niño to severe drought and forest fires that blanketed Indonesia in haze along with drought across parts of Africa, while the 1997–1998 El Niño drove record global temperatures and major flooding in California. Locally, though, the two winters told very different stories.
How did King County streams actually behave during those El Niño events? Figure 4 summarizes monthly stream temperature and flow anomalies across the county from long-term gages operated by King County and USGS, with NOAA’s Oceanic Niño Index shown below for context (Figure 4).

Both events brought warmer-than-average winters and their following springs. But flow signatures for each event were nearly opposite. Through the winter of 1997–1998, flows averaged slightly below normal, aligning with the dry-winter response expected with an El Niño year. The similarly strong 2015–2016 winter saw the opposite effect. After a warm and dry lead-in to winter attributed to “the blob” (a marine heatwave in the northern Pacific Ocean lasting from 2013 to mid-2016 that prevented typical atmospheric rivers from reaching the PNW), flows swung well above normal as the region saw one of the wettest winters on record.
Returning to the Cedar and South Fork Tolt gages (with the same graphs as Figure 3 but now tracing those two specific winters), both events showcase the warmer late-winter and spring temperatures seen countywide along with the storm-driven high flows of the 2015–2016 winter (Figure 5).

El Niño weights the atmospheric dice
One key takeaway from all of this is that a stronger El Niño doesn’t guarantee stronger local impacts; it mainly raises the odds that they occur. As University of Washington atmospheric scientist Cliff Mass put it before the last super El Niño, a strong event “heavily weights the atmospheric dice” toward a less stormy, warmer, and drier Pacific Northwest—but nothing is certain.
El Niño is also only one of many factors shaping any given winter. The Pacific Decadal Oscillation, marine heatwaves, and ordinary year-to-year variability all shape how conditions play out. What we can say is that the dice are weighted. Regional outlooks already lean toward a warmer, drier summer and elevated wildfire risk. No two El Niños are alike, and this one, like those past, will show its own hand in the coming months.