A summary of King County streams data
82 stream sites in Water Resources Inventory Areas (WRIAs) 7, 8, 9, 10, & 15* were monitored December 2025-February 2026.
Temperature (vs. normal)
- Dec: +3.8°F
- Jan: +1.3°F
- Feb: +1.2°F
Precipitation (vs. normal)
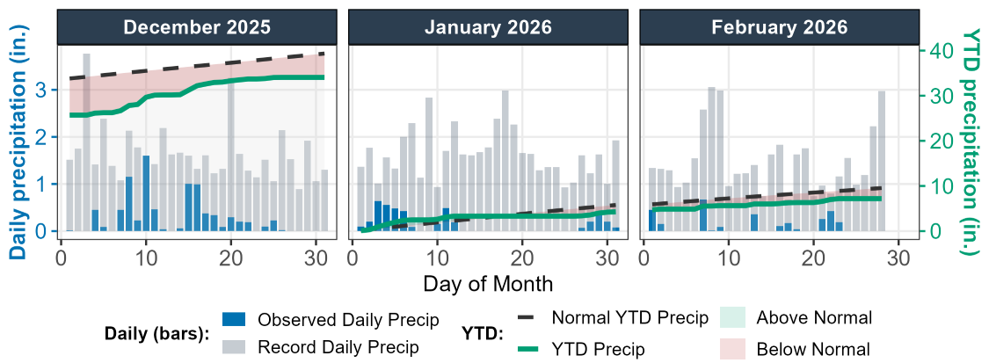
- Dec: +2.7″
- Jan: −1.5″
- Feb: −0.8″
Temperature and Precipitation data are from NOAA climate station USW00024233 at SeaTac Airport. Values shown are departures from the 1991–2020 normal.
*King County includes Vashon-Maury Island in WRIA 9 for salmon recovery and nearshore work. For all other purposes, including routine stream monitoring, it is designated as WRIA 15.

Flow
December brought historic flows. Back-to-back atmospheric rivers delivered over 3 inches of rainfall in the second week, with the month finishing at nearly 7.5 inches total. With warm temperatures, and precipitation that would otherwise fall as snow in the mountains coming down as rain, streamflows rose to exceptionally high levels. More than two-thirds of all gaged sites with at least five years of data set new record weekly average flows during the atmospheric river.
On December 10th, the Skykomish River recorded new high instantaneous and daily average flows. The following day, 88 of 95 monitored sites were in the 90th percentile of all daily flows on record, with the Cedar and Snoqualmie River station at Carnation setting new all-time instantaneous and daily average flow records. Other stations on the Snoqualmie at Fall City and the North and Middle Forks were just shy of flows recorded during the 2009 flood. Records continued to fall in the days afterward, as the Green river reached a new all-time daily average flow record on the 13th. Widespread flooding occurred across all major river basins, with flooding persisting until the end of December.
January and February were considerably drier, running roughly 50% and 60% below normal precipitation, respectively. Streamflows followed suit, with most gaged sites falling into below-normal to much-below-normal percentile classes by mid-winter.
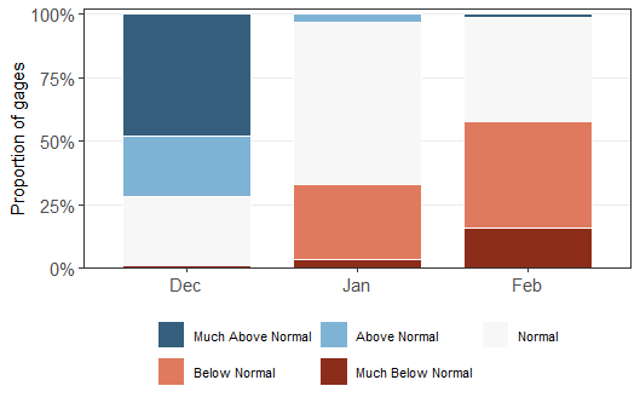

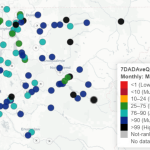
Right: Mean daily streamflow conditions across King County stream gages on December 11, 2025, shown as percentile ranks relative to the full period of record. Nearly all sites recorded flows in the Much Above Normal (>90th percentile) or High (>99th percentile) range, reflecting the atmospheric river that coincided with the winter sampling period.
Water Quality
The heavy rainfall and widespread flooding in December drove elevated levels of several water quality parameters across monitored streams. Increased runoff mobilized sediment and bacteria from the landscape, pushing total suspended solids, E. coli, and particulate phosphorus (total phosphorus) concentrations well above historical norms at many sites. Stream temperatures were also notably elevated relative to historical data in December and January, reflecting the influence of the warm front that moved through during the sampling events. The above-normal stream temperatures were associated with depressed dissolved oxygen levels at several sites, as warmer water holds less dissolved oxygen.
As conditions dried through January and February, and bicarbonate-rich groundwater comprised a greater proportion of baseflow, alkalinity and pH rose to higher levels. With less overland flow, nitrogen mobilization from the surrounding landscape (e.g. soils and alder leaf litter) declined, resulting in below-normal nitrate nitrogen and total nitrogen at many sites.
These seasonal patterns were reflected in the frequency of water quality standards exceedances across the winter. December’s storm runoff produced the most widespread water quality standards excursions of the three-month period. Nineteen sites exceeded the E. coli single-sample criterion of 320 CFU/100 mL, and 36 sites failed to meet the geometric mean criterion of 100 CFU/100 mL. Nine sites did not meet dissolved oxygen criteria, including Evans, Mercer Slough, Patterson Creek, Springbrook, Mill, Covington, Rock, and North Fork Issaquah Creek. Springbrook Creek also failed to meet the pH criterion, recording a pH of 6.42 against a standard of 6.5.
Water quality criteria excursions were considerably less widespread in January. Six sites — Evans, Mercer Slough, Springbrook, Rock, Mill, and Yarrow — continued to fall short of dissolved oxygen criteria. Only North Creek exceeded the E. coli single-sample criterion, though six sites failed to meet the geometric mean criterion.
Excursions remained limited in February. Pipers Creek and Lyon Creek exceeded the E. coli single-sample criterion, and Ames Creek recorded a pH of 6.42, falling below the 6.5 standard.