A summary of King County streams data
82 stream sites in Water Resources Inventory Areas (WRIAs) 7, 8, 9, 10, & 15* were monitored March through May 2026.
Temperature (vs. normal)
- Mar: -1.2°F
- Apr: +1.1°F
- May: +0.9°F
Precipitation (vs. normal)
- Mar: +2.5″
- Apr: −0.4″
- May: −0.7″
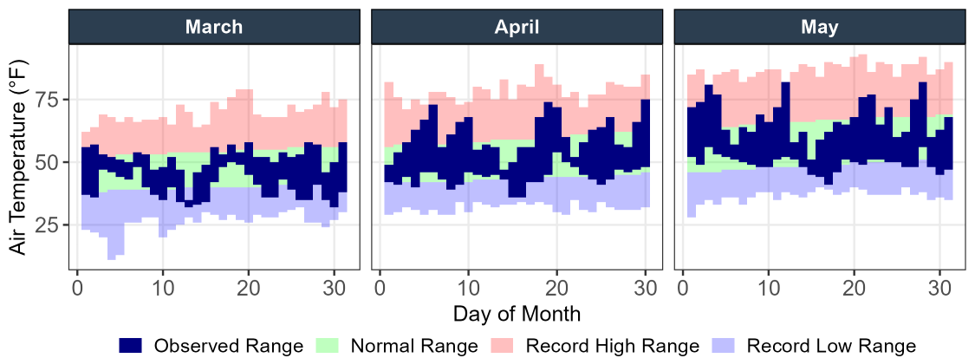
Temperature and Precipitation data are from NOAA climate station USW00024233 at SeaTac Airport. Values shown are departures from the 1991–2020 normal.
*King County includes Vashon-Maury Island in WRIA 9 for salmon recovery and nearshore work. For all other purposes, including routine stream monitoring, it is designated as WRIA 15.

Flow
Spring held true to the adage, “in like a lion, out like a lamb,” with numerous atmospheric rivers dropping nearly 7 inches of rain during the month of March, more than 2 inches above normal. Streams swelled as a result, with monthly average flows well above normal at many sites. That was especially true toward the Cascade foothills in the eastern part of the county where several sites recorded the highest monthly average flows on record.
In contrast, May saw much drier conditions, with just over 1 inch of precipitation recorded—about 40% below normal. Streamflows responded in kind, with about a quarter of all streams, especially those in the Snoqualmie Valley, averaging flows well below normal.


Right: Mean daily streamflow conditions across King County stream gages for March 2026, shown as percentile ranks relative to the full period of record. Only gages with at least 10 years of data are shown. Nearly one third of gages recorded flows in the Much Above Normal (>90th percentile) or High (>99th percentile) range.
Water Quality
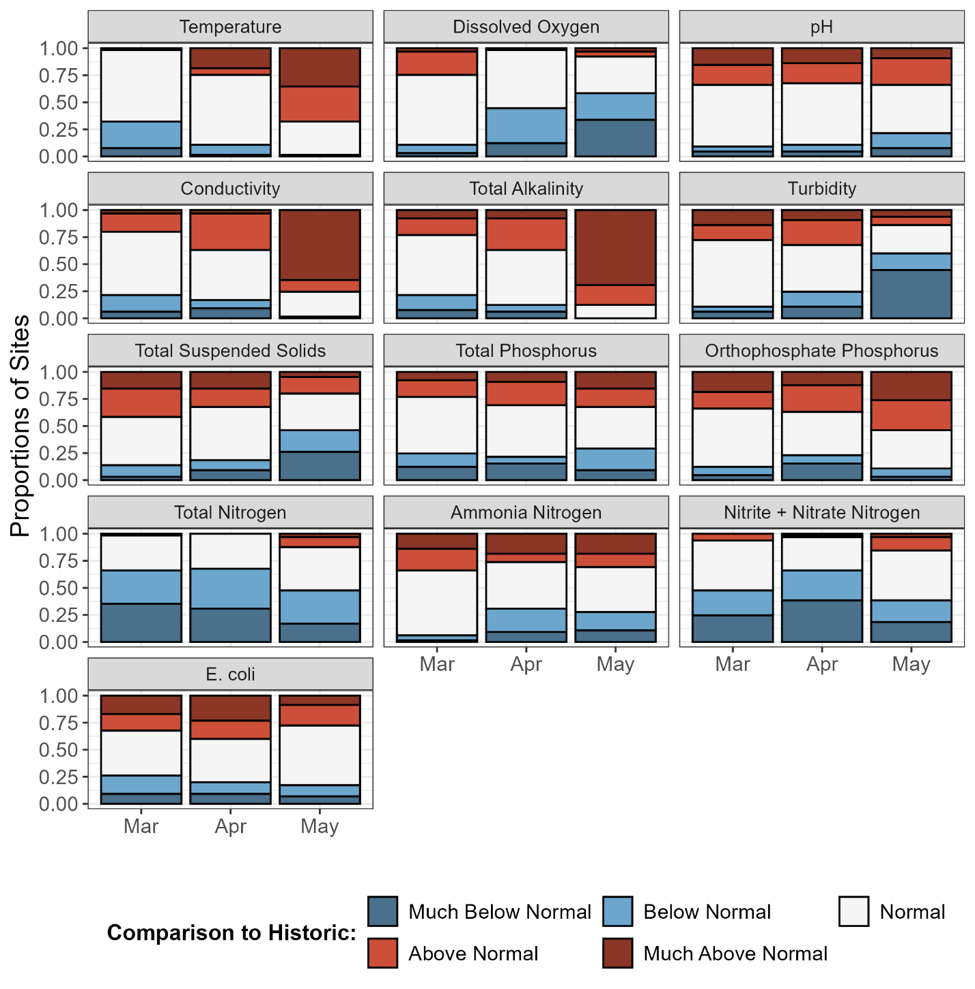
Though the weather went out like a lamb, water quality went out like a lion toward the end of spring. Water quality standards exceedances were few and far between in March but mounted through May as the season warmed and dried.
March was the eighth wettest on record. The March sampling runs on the 10th and 11th coincided with the arrival of an atmospheric river that saturated the region, resulting in increased runoff and erosion that elevated total suspended solids (TSS) and turbidity across many sites. Between the rain and cooler temperatures at the time of sampling, stream temperatures were broadly slightly below normal. Even so, three sites failed to meet the water quality criterion for dissolved oxygen, including Evans Creek and Mercer Slough in WRIA 8 and Springbrook Creek in WRIA 9.
The rest of spring brought much warmer conditions, with April and May coming in as the eighth and thirteenth warmest on record (of 82 years). Storms during the April sampling (the 14th and 15th) drove increased runoff and elevated fecal bacteria concentrations at several sites. Fifteen sites exceeded the E. coli criterion of 320 CFU/100 mL. Five of those sites exceeded 1,000 CFU/100 mL, including Taylor creek (WRIA 8), Newaukum Creek and two sites on the lower Green River (WRIA 9), and Boise Creek (WRIA 10). A warm front from the 18th through 20th pushed the Seattle Tacoma Airport[TLJ6] climate station to a new daily record of 74 degrees F on the 19th. Streams in the Snoqualmie basin (WRIA 7) sampled the next day recorded temperatures well above average.
As May arrived and the region continued to warm, the first temperature water quality criteria exceedances of the year were observed, with 14 sites across WRIAs 7, 8, and 9 exceeding Washington Department of Ecology’s criteria. With warmer water holding less oxygen, 16 sites failed to meet the water quality criterion for dissolved oxygen as well. Along with the warmth, rain was sparse. Nothing over 0.1” fell until the 13th. As groundwater dominated streamflow, alkalinity and conductivity were elevated, setting monthly high records at many sites. Bacteria lingered too—12 sites exceeded the water quality criterion for E. coli, led by Little Soos Creek at 2,300 CFU/100mL and Maplewood Creek at 1,000 CFU/100mL.