A summary of King County streams data
82 stream sites in Water Resources Inventory Areas (WRIAs) 7, 8, 9, 10, & 15* were monitored June through August** 2026.
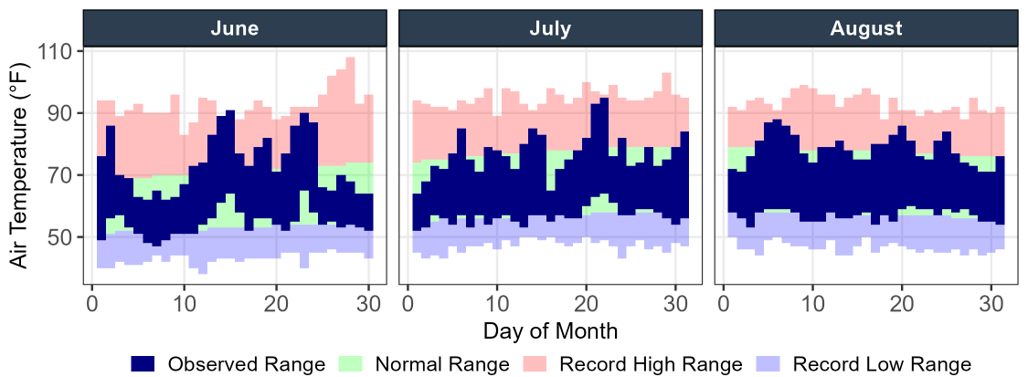
Temperature (vs. normal)
- Jun: +1.9°F
- Jul: -0.2°F
- Aug: +0.3°F
Precipitation (vs. normal)
- Jun: -0.1″
- Jul: −0.2″
- Aug: −0.4″
Temperature and Precipitation data are from NOAA climate station USW00024233 at SeaTac Airport. Values shown are departures from the 1991–2020 normal.
*King County includes Vashon-Maury Island in WRIA 9 for salmon recovery and nearshore work. For all other purposes, including routine stream monitoring, it is designated as WRIA 15.
**No samples were collected at George Davis Creek in July or Boise Creek in August due to access limitations.


Flow
A little over an inch of rain in early June helped boost streamflows after a drier-than-normal May, and a majority of gages averaged normal flows across the month. After that, rain was sparse, with only 3 days of measurable precipitation in July, and 1 day of measurable precipitation in August. July’s main storm dropped 0.36” of rainfall, and August’s only measurable precipitation event recorded just over a half an inch.
Despite the spurts of rain in July and August, streamflows declined through summer, with about half of gages averaging below or much below normal flows. The eastern part of the county, particularly the Snoqualmie basin streams, made up most of the streams with flows much below normal, while flows in streams around the western part of the county remained around normal.
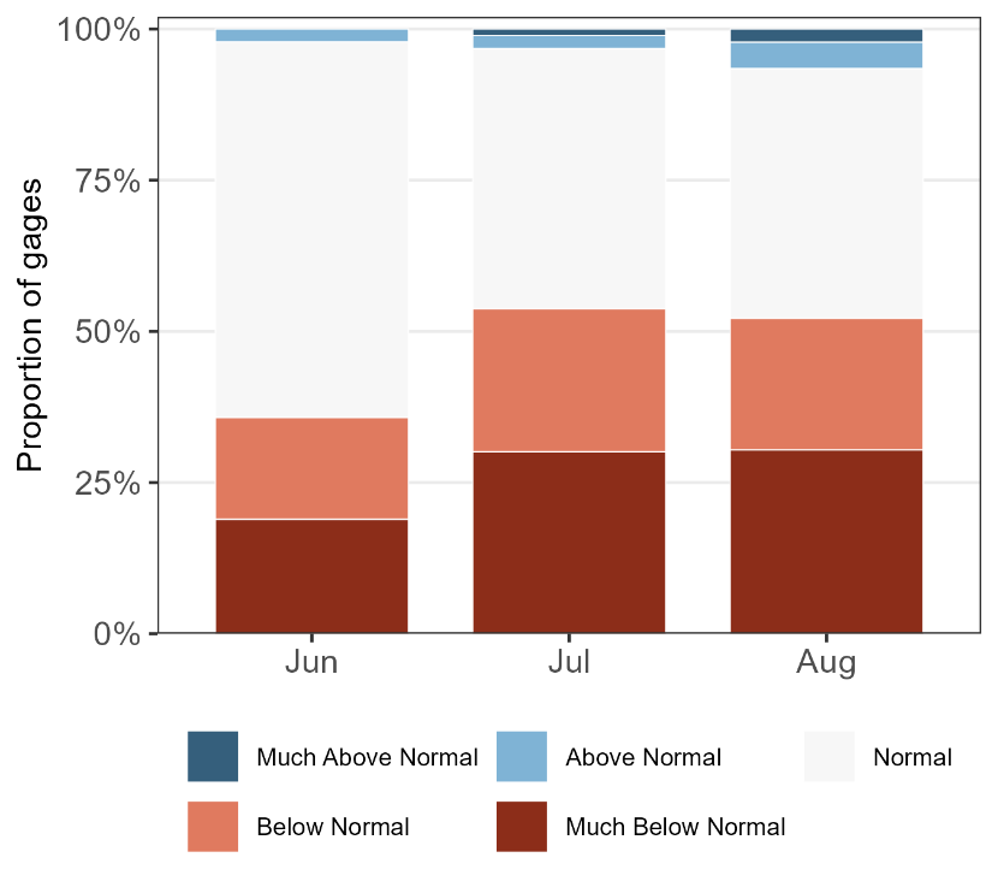
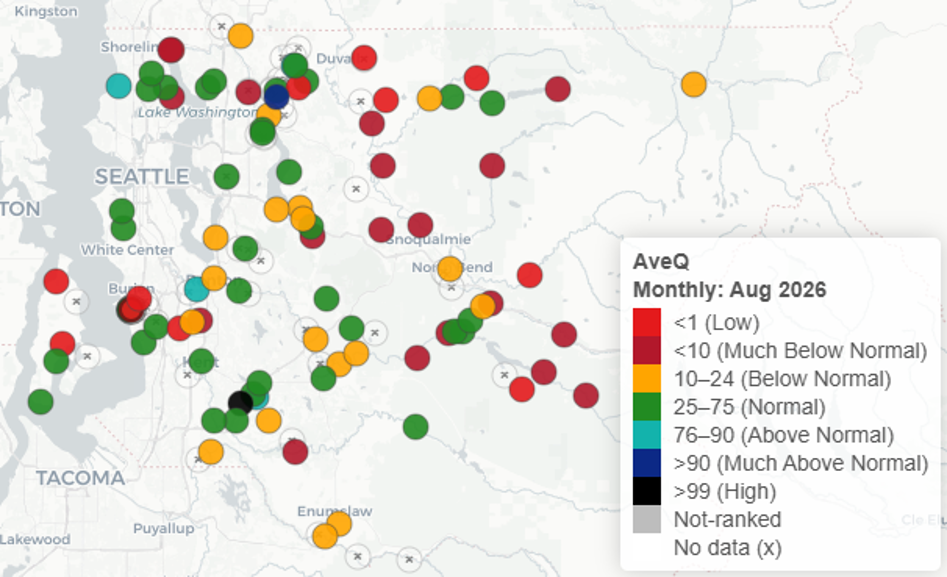
Right: Mean daily streamflow (AveQ) conditions across King County stream gages for August 2026, shown as percentile ranks relative to each gage’s full period of record. Only gages with at least 10 years of data are shown.
Water Quality
Sometimes sample results better reflect the timing of the sampling than they do the overall conditions across the month. That was the case in June, which saw widespread high levels of the fecal bacteria E. coli. Conditions were the perfect storm for E. coli. We had a long dry period followed by substantial rain, which dumped more than an inch of rain across the county over the 8th and 9th of June and washed accumulated waste into the streams immediately before and during when most sites were sampled on the 9th and 10th.
Summer months have always seen higher fecal bacteria results, on average. However, June was even worse than normal. Around half of the 82 sites monitored exceeded the single sample criterion of 320 CFU/100 mL (27 of which exceeded 1,000 CFU/100 mL), and around three fourths of sites exceeded the 3-month geometric mean criterion of 100 CFU/100 mL.
The storm also swept sediments into the water along with the waste, driving up results for turbidity, total suspended solids, and phosphorus (which is often found bound to sediments).
The sampling event on the 15th took place during a heatwave that saw temperatures breach 90 degrees F, with new daily record high temperatures recorded on the 14th and 15th at the SeaTac climate station. Consequently, several streams during the run on the 15th (the lower Cedar River and its tributaries, and the upper Snoqualmie basin sites), reached new monthly record high temperatures.
As the landscape dried across July and August, and streamflows diminished, conductivity and alkalinity increased. Water quality standards excursions for E. coli were fewer in number but still widespread across both months, with more than half of sites in July and August exceeding the 3-month geometric mean criterion of 100 CFU/100 mL.
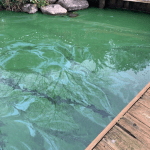
The high productivity of benthic algae communities in several streams led to supersaturated dissolved oxygen conditions, meaning the water contained more oxygen than it would normally absorb from the atmosphere under the present conditions in July and August. As the algae underwent photosynthesis and pulled carbon dioxide out of the water, the pH of the water increased. That productivity led to the first water quality standards excursions for pH this summer, as both Raging (8.68) and Sammamish (8.56) rivers recorded pH levels above the water quality criterion of 8.5. The Raging River’s productivity-driven alkaline conditions continued in August, with the pH at 8.77.