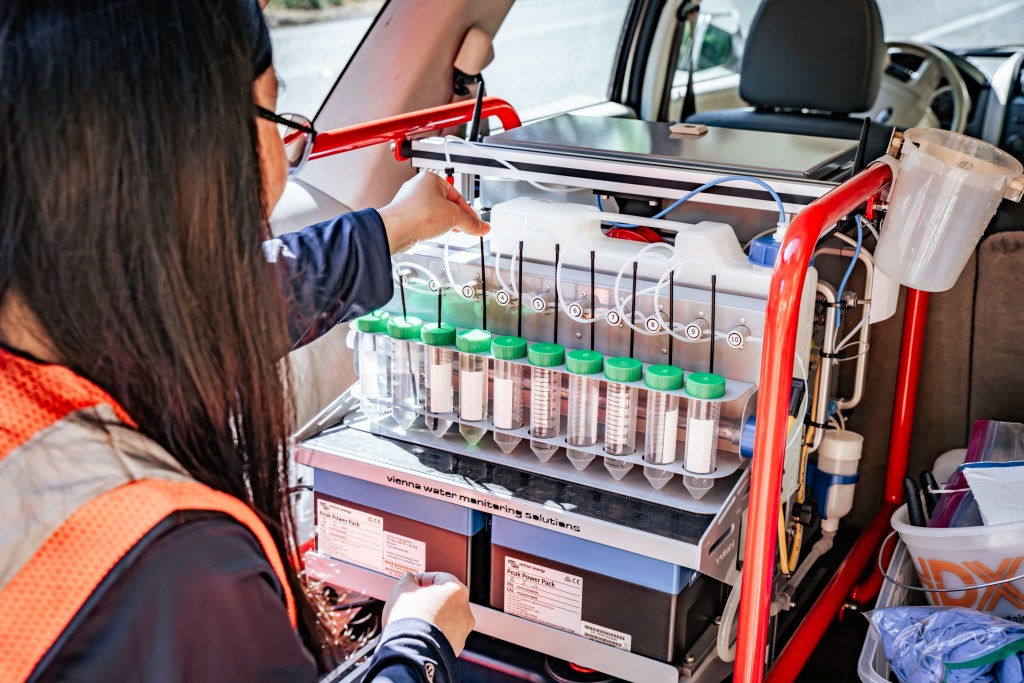
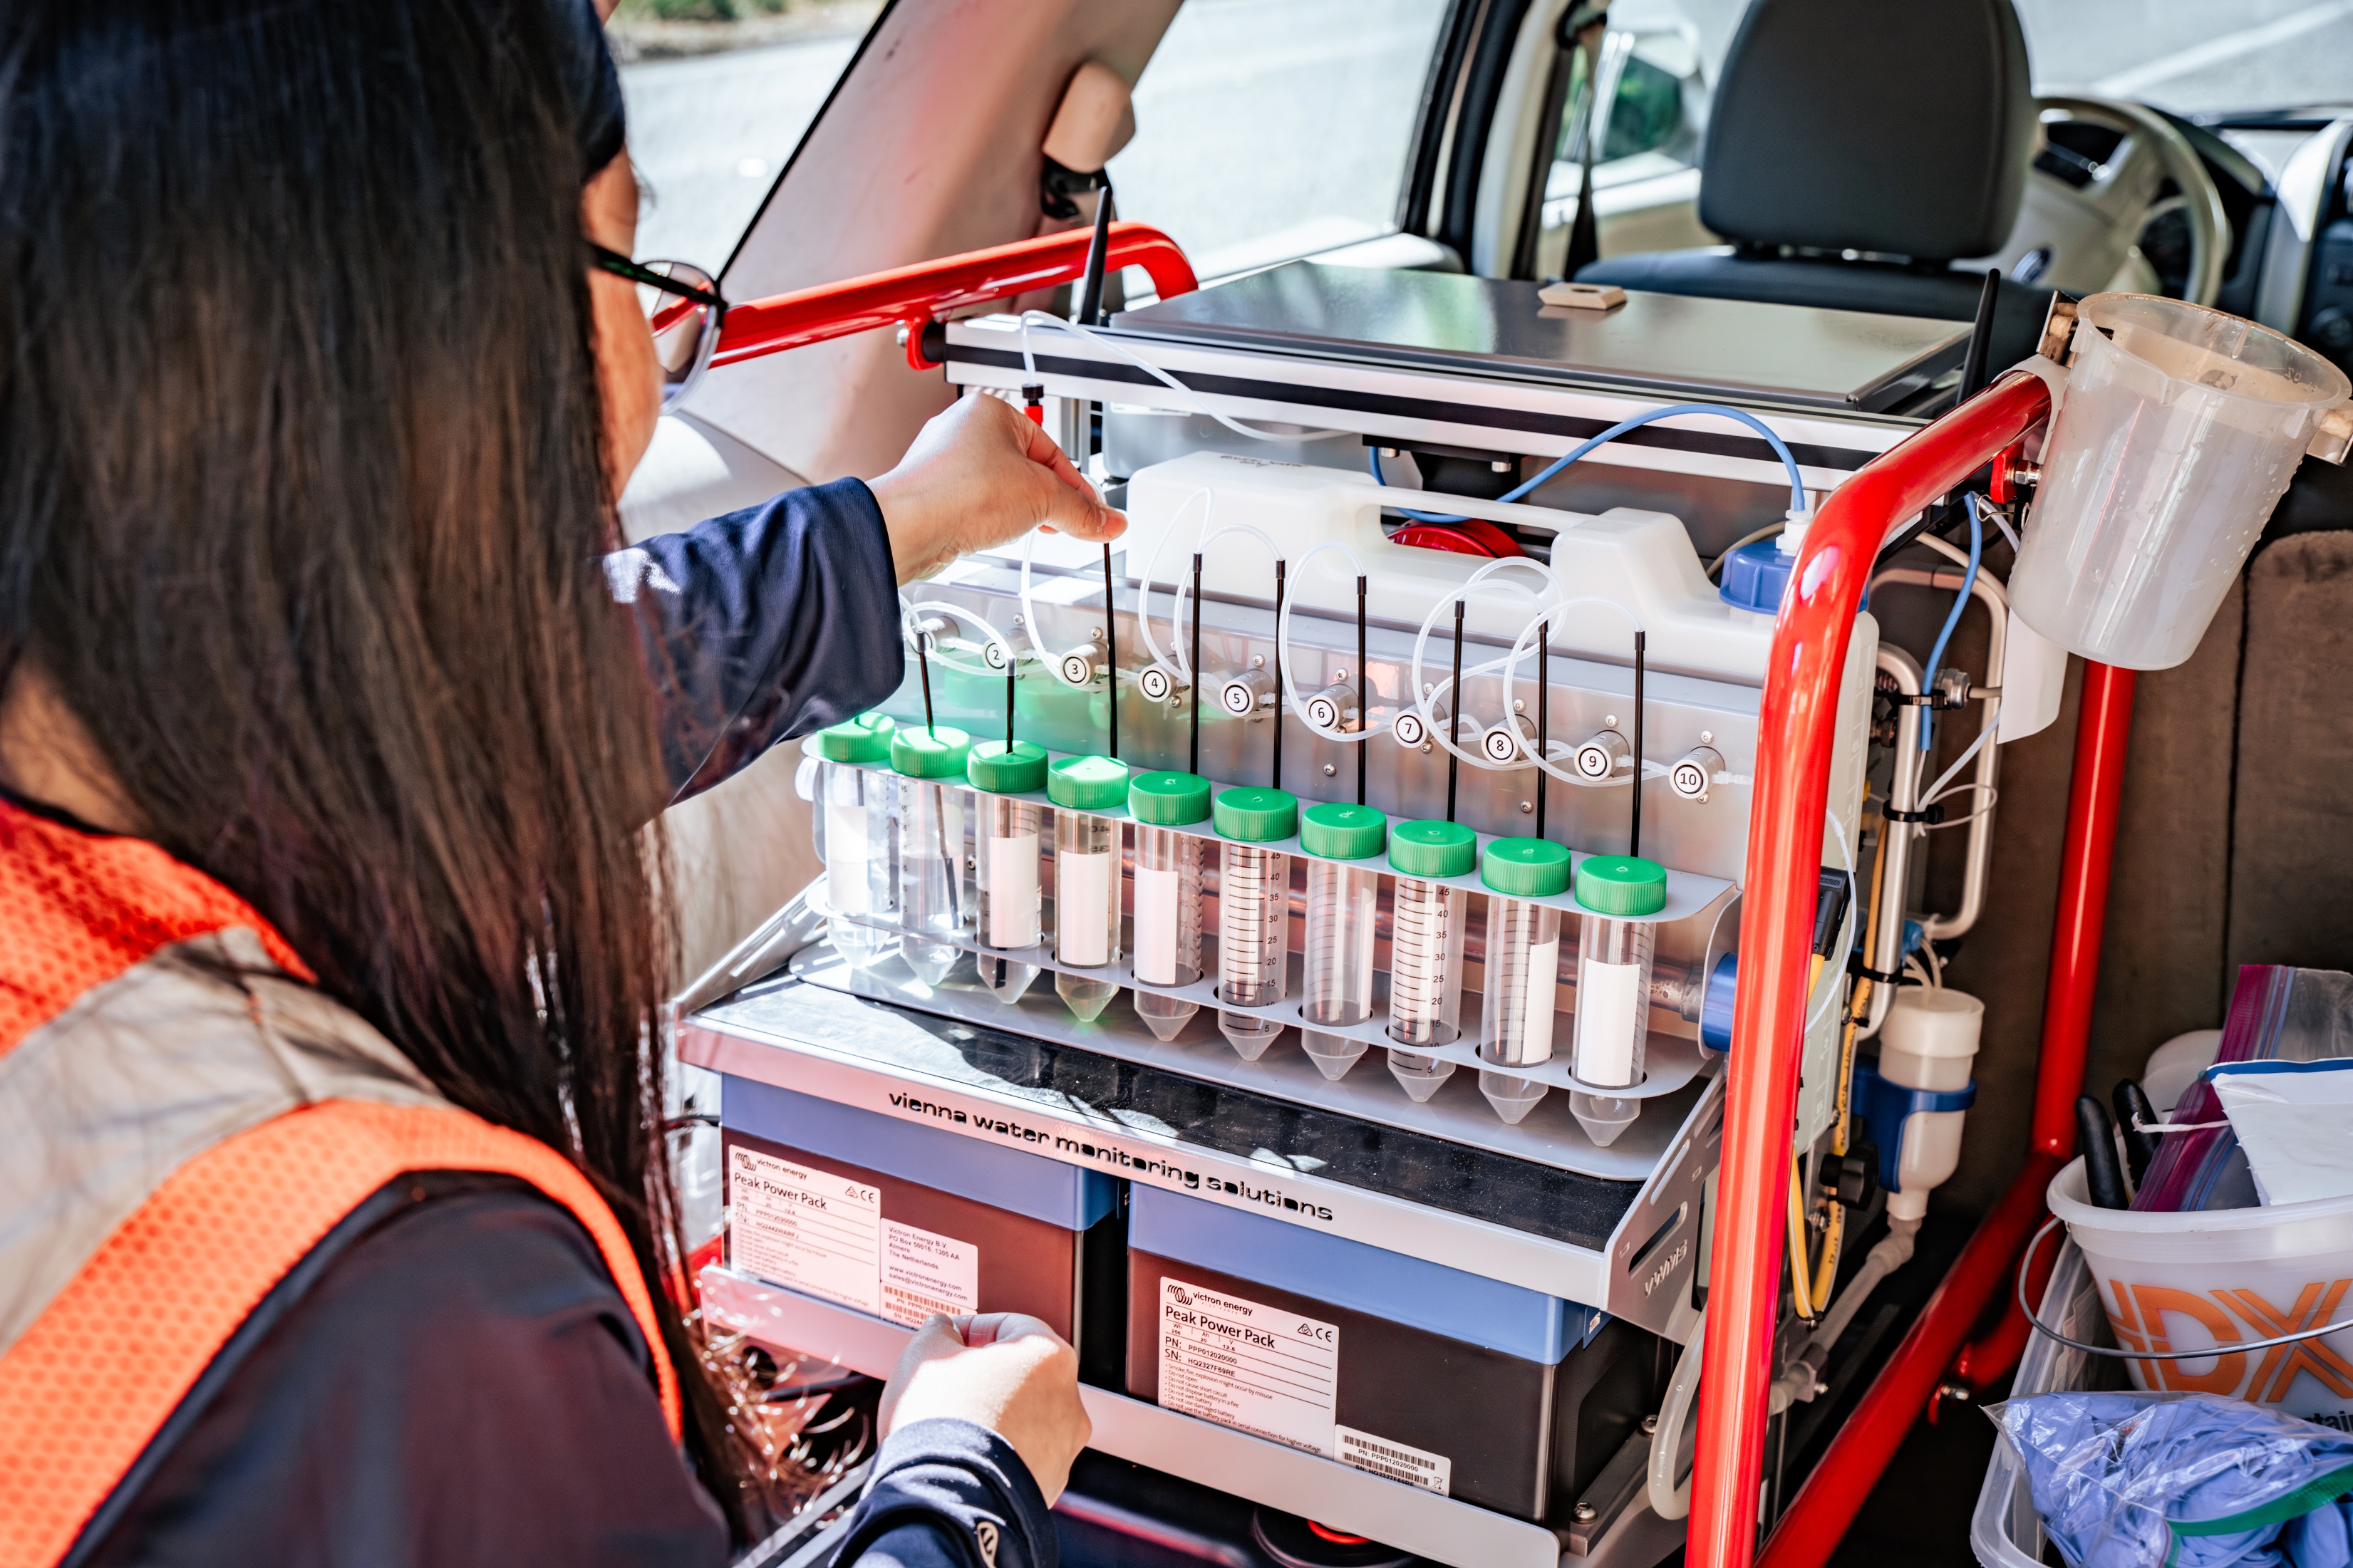
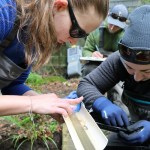
It’s a sunny morning along Poverty Bay. King County staff lower a sampling pole into a storm drain, fill a bottle, and carry it back to their car. They load it into a machine in the back of their car and press ‘run’. About 20 minutes later, the machine alerts them that the water shows signs of fecal pollution.
That instrument is a ColiMinder®, the newest tool in King County’s toolkit for cleaner water. Our Pollution Identification and Correction (PIC) program in Poverty Bay is piloting the device to see how well it can quickly detect fecal pollution in streams and stormwater drainages.
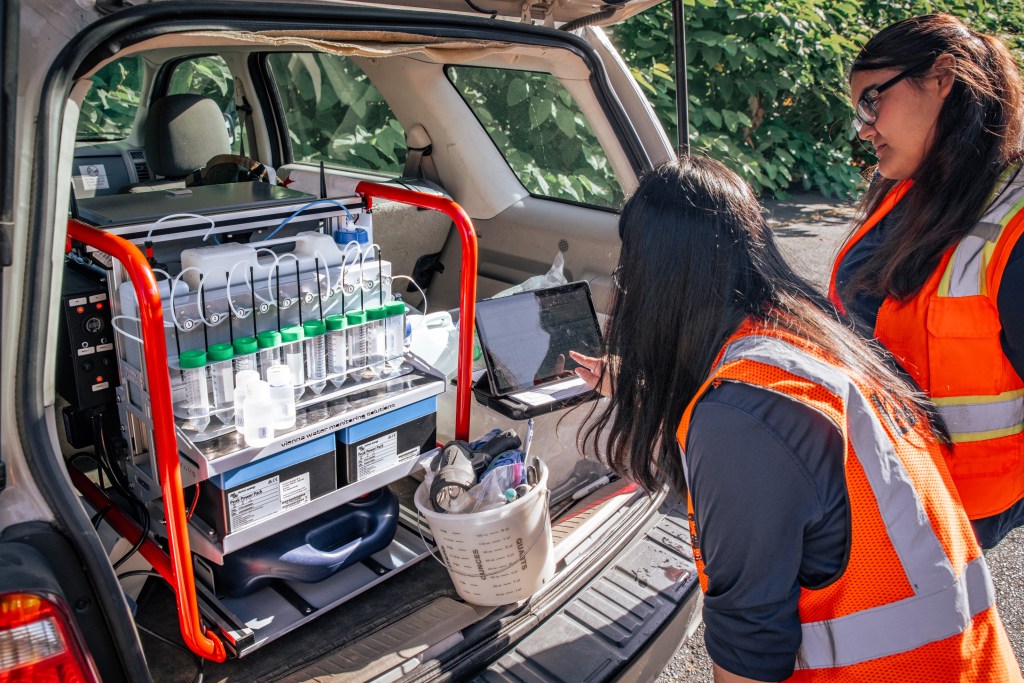
Identifying fecal pollution in King County water
Fecal pollution comes from the feces of people and warm-blooded animals, such as dogs and raccoons. It carries germs that can make swimmers sick and make shellfish unsafe to eat, which hurts Tribal and commercial fisheries. In Poverty Bay, situated between Des Moines and Federal Way, shellfish beds are closed for commercial harvesting much of the year and fully closed to public harvesting. King County has spent years working there to find and fix the sources.
Traditionally, we monitor fecal pollution by testing water for a bacterium called Escherichia coli. While most strains of E. coli are harmless, it’s a great indicator of fecal pollution and associated risks. Because E. coli lives in the guts of all warm-blooded animals, finding it in a stream is a sign that feces are in the stream, too. It’s also cheaper and easier to measure E. coli than all the different types of germs that could be in fecal pollution.
The standard laboratory test for E. coli puts a water sample in a petri dish with nutrients and incubates it for 24 hours until the microscopic bacteria grow into colonies large enough to be seen and counted.
The ColiMinder takes a different approach by measuring the activity of an enzyme the E. coli bacteria produce, called β-glucuronidase. There’s no incubation needed to grow the bacteria and results come back in as little as 20 minutes.
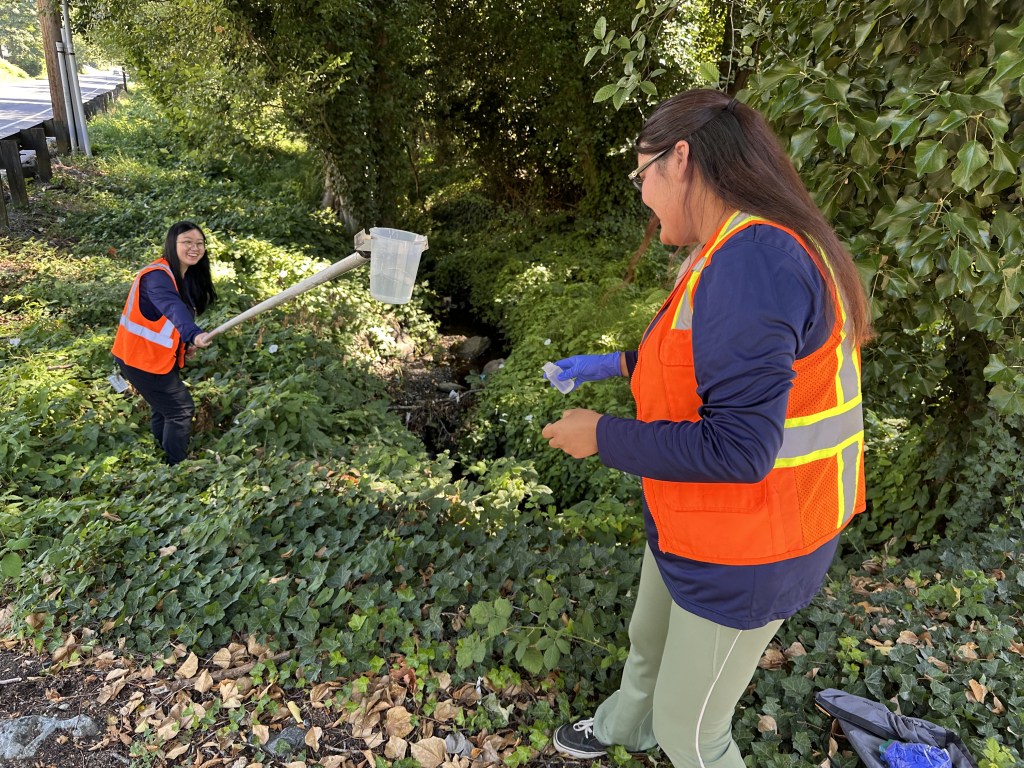
Finding and fixing the sources of fecal pollution
Finding E. coli in a stream is easy compared to finding its source. And that’s where faster test results become so important.
In urban streams, bacteria levels can vary widely from hour to hour, and most sampling sites have a mix of high and low results at different times. Even ongoing bacteria sources rarely leak at a steady rate. A failing septic system might only show up as a brief pulse after heavy water use or a storm. When results take 24 hours, that pulse may have passed by the time scientists know to follow it.
The speed of results might change how quickly and effectively we track down fecal pollution sources. If the ColiMinder performs well in testing, staff could receive a high reading, sample upstream right away, and home in on a source while it’s still flowing—all in the same day.
The ColiMinder helped monitor fecal pollution in the Seine River for events at the 2024 Paris Olympics and Paralympics and to develop early warning systems for fecal pollution at drinking water intakes. But it isn’t a replacement for lab testing. Because it measures enzyme activity rather than culturable E. coli, its results don’t translate directly into the laboratory counts used in water quality standards. Therefore, the results aren’t used for regulatory decisions. Instead, the goal is to see how well its results align with standard methods. If it holds up, we can use it as a screening tool when deciding where to focus our monitoring.
If all goes well, the next time a storm drain sample returns a high result, the crew won’t have to wait until the next day to start looking upstream.